![]()
![]()
![]()
Most economic indicators are published several times for a given reporting period, this entails revisions as time horizon changes. rjd3revisions performs a battery of tests on these revisions and generates a report with the results. The various tests enable the users to detect potential bias and sources of inefficiency in preliminary estimates.
Installation
Running rjd3 packages requires Java 17 or higher. How to set up such a configuration in R is explained here
Latest release
To get the current stable version (from the latest release):
- From GitHub:
# install.packages("remotes")
remotes::install_github("rjdverse/rjd3revisions@*release", build_vignettes = TRUE)- From r-universe:
install.packages("rjd3revisions", repos = c("https://rjdverse.r-universe.dev", "https://cloud.r-project.org"))Development version
You can install the development version of rjd3revisions from GitHub with:
# install.packages("remotes")
remotes::install_github("rjdverse/rjd3revisions", build_vignettes = TRUE)
Usage
library("rjd3revisions")
#>
#> Attaching package: 'rjd3revisions'
#> The following object is masked from 'package:utils':
#>
#>     View
First you need to get your input data set as a data.frame in R in a specific format as below. Note that missing values can either be mentioned as NA (as in the example below) or not be included in the input at the best convenience of the user.
Format 1: long view
| rev_date | time_period | obs_values |
|---|---|---|
| 2022-07-31 | 2022Q1 | 0.8 |
| 2022-07-31 | 2022Q2 | 0.2 |
| 2022-07-31 | 2022Q3 | NA |
| 2022-07-31 | 2022Q4 | NA |
| 2022-08-31 | 2022Q1 | 0.8 |
| … | … | … |
Format 2: vertical view
| Period | 2023/03/31 | 2023/04/30 | 2023/05/31 |
|---|---|---|---|
| 2022M01 | 15.2 | 15.1 | 15.0 |
| 2022M02 | 15.0 | 14.9 | 14.9 |
| … | … | … | … |
| 2023M01 | 13.0 | 13.1 | 13.2 |
| 2023M02 | 12.1 | 12.1 | |
| 2023M03 | 12.3 |
Format 3: horizontal view
| Period | 2022M01 | 2022M02 | … | 2023M01 | 2023M02 | 2023M03 |
|---|---|---|---|---|---|---|
| 2023/03/31 | 15.2 | 15.0 | … | 13.0 | ||
| 2023/04/30 | 15.1 | 14.9 | … | 13.1 | 12.1 | |
| 2023/05/31 | 15.0 | 14.9 | … | 13.2 | 12.1 | 12.3 |
Depending on the location of your input data, you can use create_vintages_from_xlsx() or create_vintages_from_csv(), or the more generic function create_vintages() to create the vintages.
set.seed(7)

# Examples
long_view <- simulate_long(
    periodicity = 4,
    n_period = 4 * 10,
    n_revision = 7,
    start_period = as.Date("2000-01-01")
)
Then you can create your vintages and plot the vintages and inspect the revisions (optional)
vintages <- create_vintages(long_view, periodicity = 4)
plot(vintages, lwd = 2)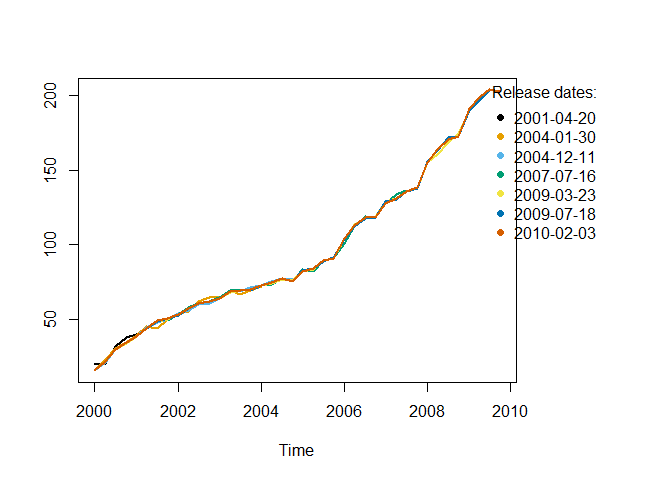
revisions <- get_revisions(vintages, gap = 2)
plot(revisions)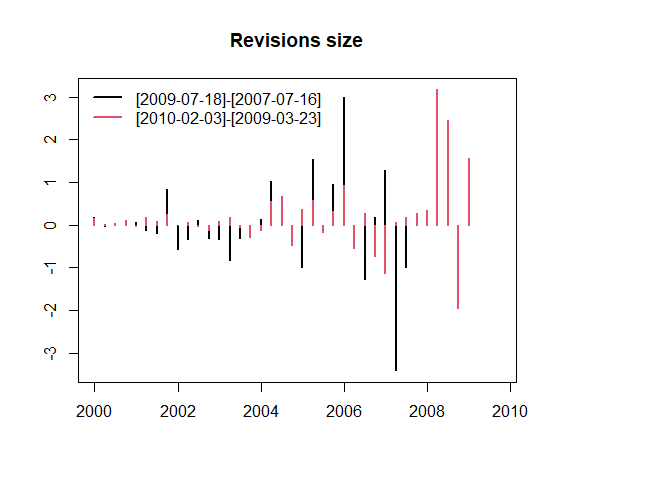
and make the analysis
rslt <- revision_analysis(vintages, gap = 1, view = "diagonal", n.releases = 3)

print(rslt)
#>                                            Transf. [Release[2]]-[Release[1]]
#> Relevancy - Theil U2                          None              Good (0.339)
#> Bias1 T-test                                  None              Good (0.798)
#> Bias2 Augmented T-test                        None              Good (0.823)
#> Bias3 SlopeAndDrift (Ols L on P) - Mean       None              Good (0.347)
#> Bias3 SlopeAndDrift (Ols L on P) - Reg.       None              Good (0.232)
#> Efficiency1 (Ols R on P) - Mean            Delta 1              Good (0.166)
#> Efficiency1 (Ols R on P) - Reg.            Delta 1              Good (0.107)
#> Efficiency2 (Ols Rv on Rv_1) - Mean           None
#> Efficiency2 (Ols Rv on Rv_1) - Reg.           None
#> Orthogonality1 (Ols Rv on Rv_(1:p)) - Mean    None
#> Orthogonality1 (Ols Rv on Rv_(1:p)) - Reg.    None
#> Orthogonality2 (Ols Rv on Rv_k.) - Mean       None
#> Orthogonality2 (Ols Rv on Rv_k) - Reg.        None
#> Orthogonality3 AutoCorrelation (Ljung-Box)    None              Good (0.417)
#> Orthogonality4 Seasonality (Ljung-Box)     Delta 1              Good (0.993)
#> Orthogonality4 Seasonality (Friedman)      Delta 1              Good (0.137)
#> SignalVsNoise1 - Noise (Ols R on P)        Delta 1              Good (0.082)
#> SignalVsNoise2 - Signal (Ols R on L)       Delta 1         Uncertain (0.053)
#>                                            [Release[3]]-[Release[2]]
#> Relevancy - Theil U2                                    Good (0.225)
#> Bias1 T-test                                            Good (0.805)
#> Bias2 Augmented T-test                                  Good (0.806)
#> Bias3 SlopeAndDrift (Ols L on P) - Mean                 Good (0.584)
#> Bias3 SlopeAndDrift (Ols L on P) - Reg.                 Good (0.624)
#> Efficiency1 (Ols R on P) - Mean                         Good (0.300)
#> Efficiency1 (Ols R on P) - Reg.                         Good (0.240)
#> Efficiency2 (Ols Rv on Rv_1) - Mean                     Good (0.818)
#> Efficiency2 (Ols Rv on Rv_1) - Reg.                     Good (0.298)
#> Orthogonality1 (Ols Rv on Rv_(1:p)) - Mean              Good (0.818)
#> Orthogonality1 (Ols Rv on Rv_(1:p)) - Reg.              Good (0.702)
#> Orthogonality2 (Ols Rv on Rv_k.) - Mean                 Good (0.818)
#> Orthogonality2 (Ols Rv on Rv_k) - Reg.                  Good (0.298)
#> Orthogonality3 AutoCorrelation (Ljung-Box)              Good (0.999)
#> Orthogonality4 Seasonality (Ljung-Box)                  Good (1.000)
#> Orthogonality4 Seasonality (Friedman)                   Good (0.769)
#> SignalVsNoise1 - Noise (Ols R on P)                     Good (0.248)
#> SignalVsNoise2 - Signal (Ols R on L)               Uncertain (0.856)
# summary(rslt)
View(rslt)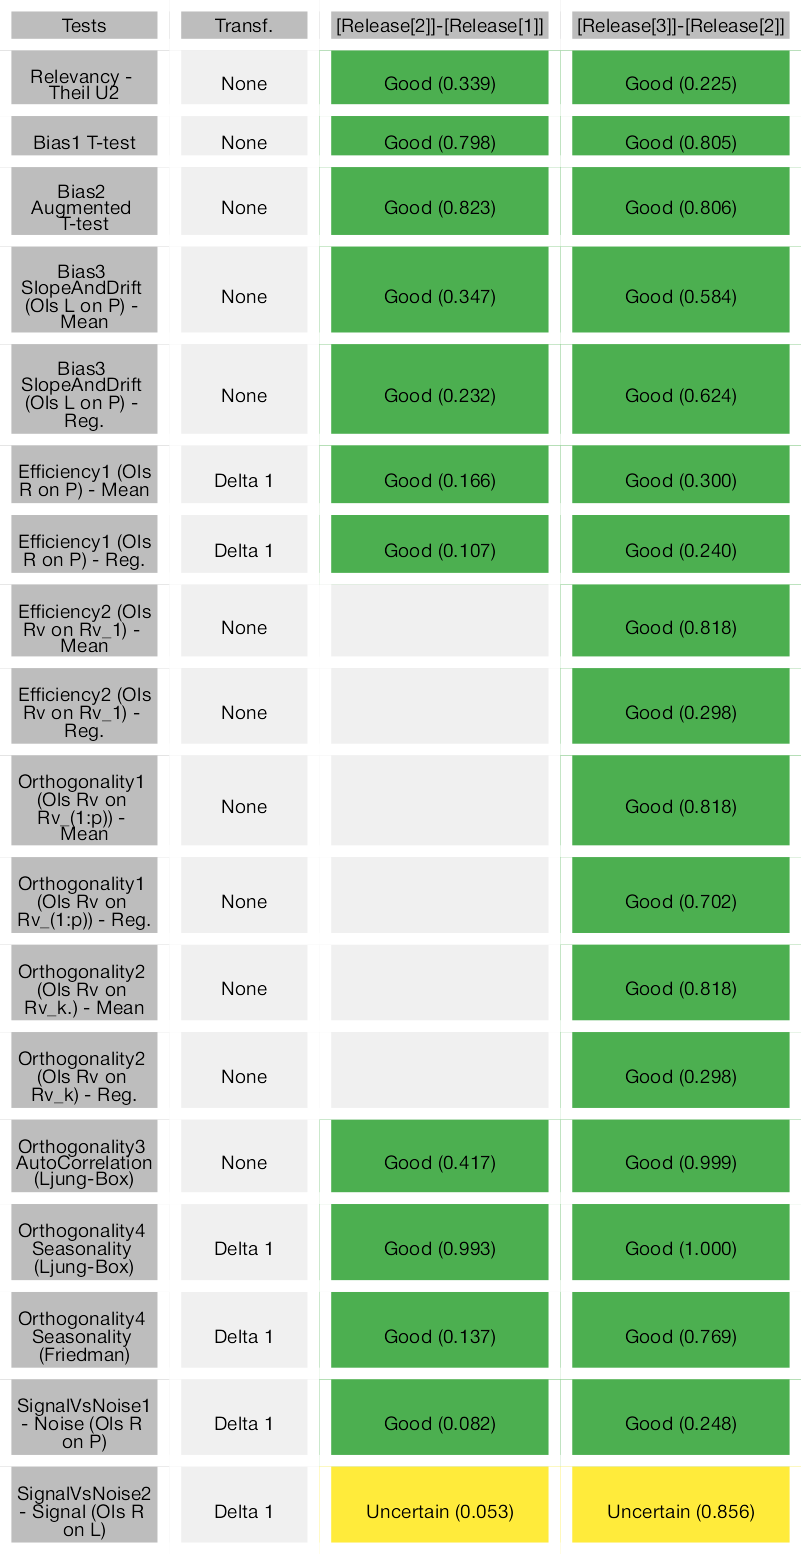
Finally to create a report and get a summary of the results, you can use
render_report(
    rslt,
    output_file = "my_report",
    output_dir = tempdir(),
    output_format = "pdf_document"
)
Additional information
This README.md file gives you a quick example of how to proceed. Consult the vignette (with browseVignettes("rjd3revisions")) and the documentation of each function (for example: ?create_vintages, ?revision_analysis) to see the current possibilities of the tool.
Package Maintenance and contributing
Any contribution is welcome and should be done through pull requests and/or issues. pull requests should include updated tests and updated documentation. If functionality is changed, docstrings should be added or updated.
Licensing
The code of this project is licensed under the European Union Public Licence (EUPL).